Project · 2023–2026
Plataforma de Dados & Marketing Analytics
A production data platform I designed and operate on Microsoft Fabric — 137 items, a medallion lakehouse and a 133-table star schema fed by PySpark from 9+ sources, from ad click to conversion.
Data scattered across nine systems only becomes a decision when someone brings it into a single place, in the right shape and at the right time. That's the platform I built: a medallion lakehouse turning raw sources into models leadership reads in Power BI.
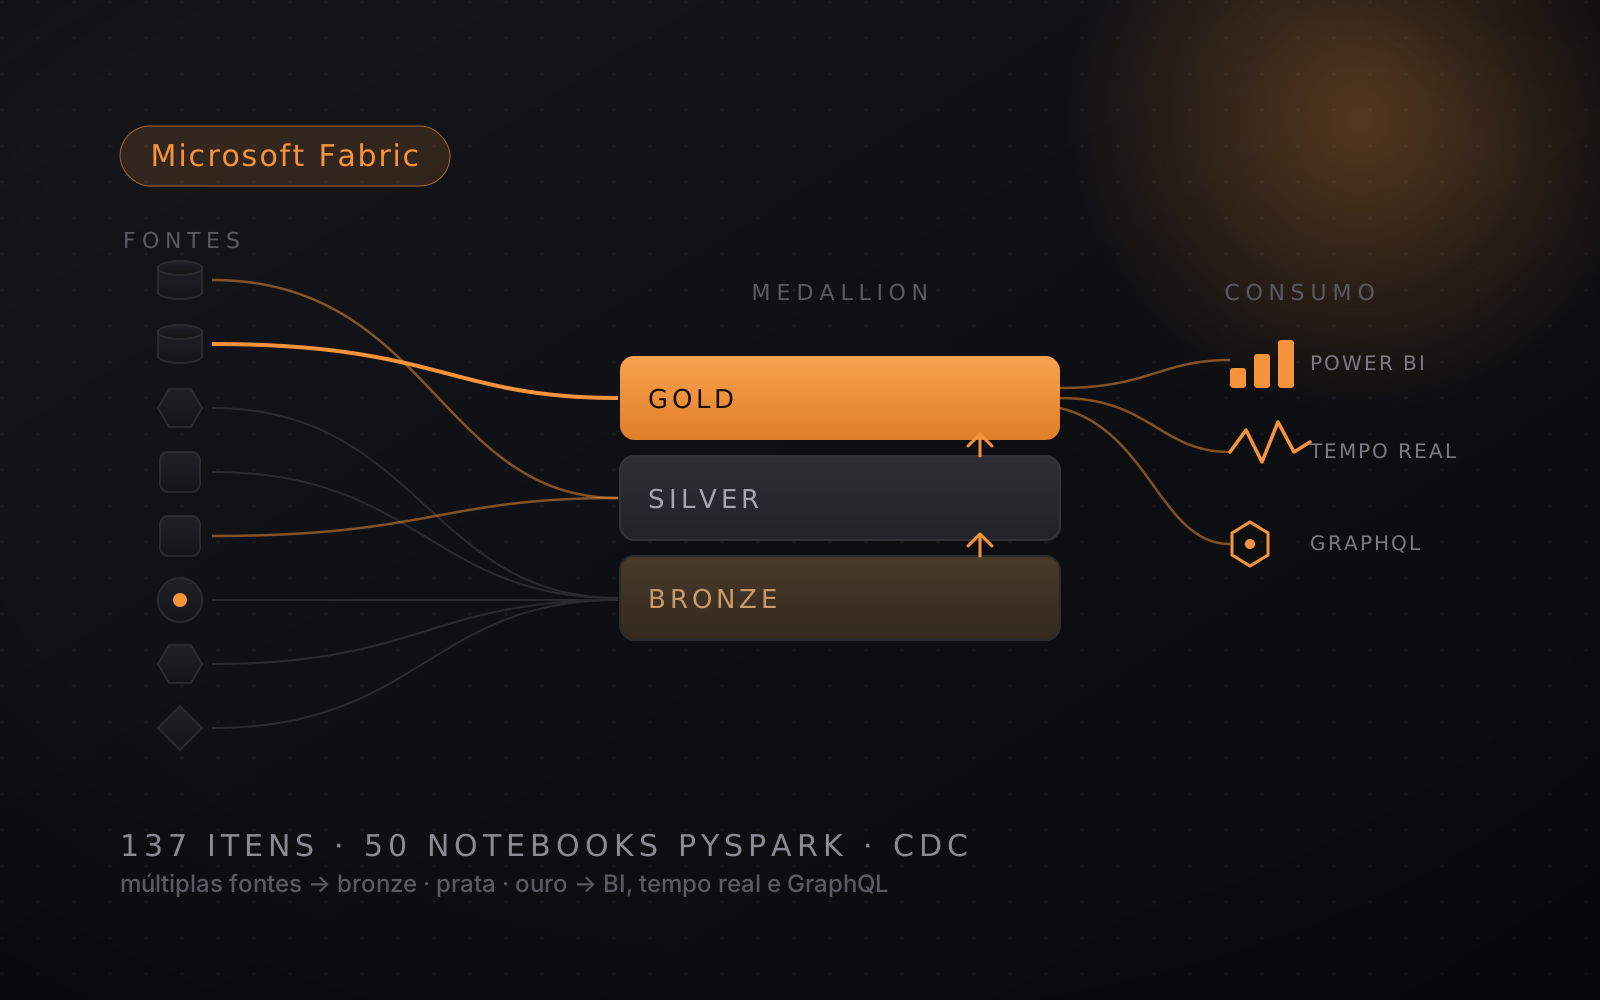
I designed and operate, end to end, a production data platform on Microsoft Fabric for a large organization — 137 items published in the production workspace: 52 dataflows, 50 PySpark notebooks, 21 pipelines, 6 lakehouses, 4 warehouses, a real-time Eventhouse and a GraphQL API.
Its heart is a medallion-architecture lakehouse (bronze/silver/gold): PySpark ingestion brings in and sanitizes data from 9+ heterogeneous sources — the on-premises academic Oracle and corporate ERP, the ad-platform APIs (Meta and Google Ads), CRM and marketing-automation tools, Lattes/CNPq academic résumés and regulatory microdata (national exams/INEP). The gold layer yields 133 tables modeled in a star schema, dimensions and facts, uniting the academic and corporate worlds.
Truly incremental ingestion: instead of reloading everything each run, the pipelines capture only what changed — and even track deletions (CDC over Oracle). Processing cost tracks the delta, not the size of the base; that's what makes a platform this size fit the budget and run every day.
A full marketing-analytics funnel — from ad click to conversion — computing CPC, CAC and ROAS over the ad data on a daily cycle, integrated with WhatsApp via API: data leaves the lakehouse and returns as a commercial action.
Real-time analytics with Eventhouse/KQL, semantic models with pipeline-orchestrated refresh, Power BI (including Embedded) and data served through a GraphQL API. All of it versioned in Git with deployment pipelines (DataOps) and separate environments in the tenant — production, development, simulation and an executive cockpit —, plus the on-premises gateway and the Azure/Fabric licensing I configure and maintain.
By the numbers
- 137
- Items in production
- 133
- Star-schema tables
- 9+
- Sources integrated
- 52
- Dataflows
- 50
- PySpark notebooks
- 21
- Orchestrated pipelines
- 6
- Lakehouses
- 8
- Workspaces in the tenant
- 3
- Years in production
- 24h
- Ad-data refresh cycle
Engineering decisions
- 01
End-to-end medallion
I chose to separate raw data from trusted data in layers: bronze takes the source as it is, silver cleans and reconciles, gold delivers the consumption-ready model. Each layer has a single responsibility, so a source error never reaches the dashboard — and I can reprocess from the right point without redoing everything.
- 02
Incremental ingestion with CDC over Oracle
Reloading the whole base every day would be slow and expensive. The pipelines capture only what changed since the last load and also track deletions (CDC), so the lakehouse never keeps a record that already died at the source. Processing cost then tracks the volume of change, not the total size of the base.
- 03
Two worlds in one star schema
The academic side (students, contracts, courses, census) and the corporate side (payroll, accounting, budget, purchasing) speak different languages. I modeled 133 tables into dimensions and facts that conform these sources — the same notion of time, of course, of cost center — so a question can cross enrollment and revenue with no hacks.
- 04
From click to conversion
The funnel joins paid media (Meta and Google Ads) with the CRM and enrollment, and computes CPC, CAC and ROAS on a daily cycle — what the click cost, what the student cost, what the ad returned. And it closes the loop: data leaves the lakehouse and comes back as a WhatsApp message, becoming a commercial action rather than just a report.
- 05
Consumption beyond the dashboard
Not every data consumer is a screen. Beyond Power BI (including Embedded), the platform serves real-time analytics through Eventhouse/KQL and exposes data through a GraphQL API — the same lakehouse feeding dashboards, systems and ad-hoc queries through whichever path fits each one.
- 06
DataOps: the platform treated as software
Everything lives in Git with deployment pipelines and separate environments in the tenant — production, development, simulation and an executive cockpit. I set up the on-premises gateway linking the cloud to the internal databases, and I manage Azure/Fabric licensing. It's not a pile of notebooks: it's a versioned, promotable, operable platform.
Architecture
Fontes
9+ heterogeneous sources
On-prem academic Oracle and corporate ERP, ad APIs, CRM/marketing and regulatory data.
Ingestão PySpark
Bronze, incremental
50 notebooks and 52 dataflows; delta-only loads and deletion tracking (CDC).
Medallion
Bronze → silver → gold
Sanitizing and reconciling layer by layer up to the consumption-ready model.
Lakehouse
OneLake · star schema
6 lakehouses; 133 dim/fact tables uniting academic and corporate.
Orquestração
21 pipelines
Dependencies, scheduling and semantic-model refresh.
Marketing funnel
Click → conversion
CPC, CAC and ROAS on a daily cycle; action back via WhatsApp.
Consumo
Power BI · KQL · GraphQL
Dashboards and Embedded, real time via Eventhouse and a GraphQL API.
DataOps
Git · deploy · gateway
Versioning, deployment pipelines, separate environments and on-prem gateway.
Stack